US DOLLAR
Summary:
In August, the Mini U.S. Dollar Index® Futures (SDX) exhibited a dynamic performance, influenced by a mix of economic data and market sentiment. The month started with strong demand for the U.S. Dollar, supported by better-than-expected ADP employment change figures for July. However, as the SDX approached a resistance zone between 102.65 and 103.10, bearish pressure emerged, leading to a brief pullback. Despite this setback, the SDX closed the first week with a modest gain of 0.43%.
MARKET CONDITIONS:

The following week witnessed a predominantly bullish market sentiment, with the SDX trading higher. Yet, the bears made a temporary return as the SDX encountered a daily resistance area at 102.35 - 102.55, formed the previous week. The SDX found support at the daily 20 EMA after the release of softer-than-expected Core inflation data on August 10th. The week concluded with the SDX closing at 102.69, marking an increase of 0.84%.
The demand for the U.S. Dollar persisted, driving the SDX higher throughout the subsequent week. This upward trajectory was further fueled by the release of FOMC minutes, which hinted at the possibility of future rate hikes. The SDX closed the week at 103.28, with a gain of 0.57%.
However, the following week brought a reversal of fortunes. The bears briefly took control as the SDX faced resistance at the upper boundary of the daily Bollinger Bands on August 23rd. This resistance intensified as worse-than-expected S&P Global Manufacturing and Services PMI data were released. Nevertheless, the bulls made a strong comeback, propelling the SDX to reach a monthly high of 104.35 on August 25th, concluding the week with a gain of 0.71%.
The bullish momentum lost steam in the final week of the month, as the bears returned, pushing the SDX lower for three consecutive days. The index eventually found support at the midpoint of the daily Bollinger Bands on the last trading day. The Mini U.S. Dollar Index® Futures closed the month at 103.59, recording a notable gain of 1.93%.
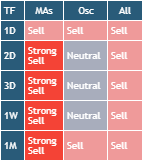
Based on technical indicators, the SDX is currently in an uptrend on both the daily and weekly timeframes. Daily technical indicators suggest strong buying sentiment overall, primarily based on moving averages. However, technical oscillators indicate mostly neutral conditions, potentially prompting investors to consider waiting for a pullback before considering buying opportunities.
Looking ahead, historical volatility suggests that the price from the prior month's close could fluctuate between 105.84 and 101.23 within the next 31 days. Investors and traders may contemplate the weekly support levels between 102.55 and 100.41 or the resistance zones ranging from 110.64 to 112.95 for strategizing their entries or exits, depending on their unique trading strategies.
In this ever-evolving financial landscape, powerful trading technology plays a crucial role in analyzing markets, identifying opportunities, and managing risks effectively. Traders are increasingly relying on sophisticated tools like AutoClimate and AutoUFOs, which are discreetly employed by professionals to gain valuable insights and navigate the complexities of the market.
It's important to keep in mind that the foreign exchange market, particularly the U.S. Dollar Index, is profoundly impacted by various economic indicators, geopolitical developments, and central bank policies. Staying well-informed about these factors is essential for making informed trading decisions.
In conclusion, trading in the foreign exchange market, especially with a focus on the U.S. Dollar, requires vigilant analysis, adaptation to market dynamics, and prudent risk management. Upcoming high-impact events like the Consumer Price Index and the Fed's Interest Rate Decision should be closely monitored, as they can significantly influence market sentiment. Traders should remember that while trading offers opportunities, it also involves inherent risks, and seeking professional financial advice is always advisable.
BITCOIN
Summary:
In August, Bakkt Bitcoin (USD) Cash Settled Monthly Futures (BMC) embarked on a volatile journey, initially attempting to breach the $30,000 level but ending up retracing to approximately $26,092 by month-end. This marked an 11.9% decline compared to July. The market experienced significant fluctuations driven by various factors.
MARKET CONDITIONS:

One key development was the United States Securities and Exchange Commission's (SEC) decision to delay evaluating spot Bitcoin exchange-traded fund (ETF) applications until October. These applications, including those from Bitwise, BlackRock, Invesco Galaxy, Valkyrie Digital Assets, VanEck, WisdomTree, and Wise Origin, hold the potential to provide retail investors with a familiar route into digital assets.
Technical indicators reflected substantial selling pressure, particularly when considering daily and weekly moving averages. The majority of technical oscillators also indicated selling conditions, emphasizing the prevailing bearish sentiment in the market.
Looking ahead, based on historical volatility, BMC's price could range between $22,475 and $29,710 in the next 30 days, highlighting the market's continued unpredictability. Investors and traders may find it prudent to monitor the weekly support ($15,567 to $16,580) and resistance ($28,710 to $30,192) levels as they plan their trading strategies.
In the realm of cryptocurrency trading, market participants can significantly benefit from advanced trading technology like AutoClimate or AutoUFOs. These tools, favored by seasoned traders, offer invaluable insights, assisting traders in analyzing market trends, identifying potential opportunities, and mitigating risks effectively.
It's essential to remember that the cryptocurrency market is inherently volatile and influenced by a multitude of factors, including regulatory developments, macroeconomic events, and investor sentiment. As such, traders should exercise caution, stay informed, and conduct thorough research before making any investment decisions. Cryptocurrency investments carry inherent risks, and it is advisable to seek professional financial advice when navigating this dynamic market.
The upcoming April 2024 Bitcoin halving event adds an extra layer of complexity to the market's outlook, as such events historically impact Bitcoin's supply and demand dynamics, potentially influencing its price trajectory. As we move forward, maintaining a keen eye on both global and crypto-specific events will be pivotal in making informed trading decisions.
ASIA TECH
Summary:
In August, the Micro Asia Tech 30 Index Futures (ATI) showcased a notable market pattern, forming a contracting wedge characterized by higher lows and lower highs. This pattern emerged as the index created its third higher low above the $3,100 level, complementing the higher lows seen in March and April. Simultaneously, the index established a second lower high from the peak observed in February, remaining below the $3,600 range. The month concluded with ATI closing at $3,301, reflecting a 6.9% decline compared to July but recovering from the month's low at $2,470.
MARKET CONDITIONS:
The performance of index component stocks across Asian countries during the month was predominantly bearish, with fewer than 20% closing higher for the month. Notable gainers included Z Corporation, Fujifilm Holdings, and Tokyo Electron in Japan, along with MediaTek in Taiwan.
Chinese component stocks, on the other hand, witnessed widespread declines. Xiaomi was a marginal exception, edging up by 0.7%. JD.com led the decliners with a 19.4% fall, followed by Bilibili, Inc. (-18.0%), Sunny Optical Technology (-15.2%), and Meituan (-12.2%). Other stocks, including Baidu, Tencent, Alibaba, Kuaishou Technology, and NetEase, experienced declines of under 10%.
In Taiwan, component stocks were weakened, particularly Delta Electronics, which fell by 5.3%. United Microelectronics Corp and Taiwan Semiconductor also recorded declines.
Japanese components displayed mixed movements, with Z Corporation as the top gainer at 10.7%. Sony Group and Keyence faced losses of 8.8% and 5.1%, respectively. Other stocks, such as Nintendo, Canon Inc., Murata Manufacturing, Fujitsu, and NTT Data, experienced declines of under 4%.
Korean component stocks saw losses across the board, with Samsung SDI, Kakao, Naver Corp, Samsung Electronics, and SK Hynix all posting declines.
Technical indicators suggested a strong selling market condition during the month, with daily and weekly moving averages providing neutral signals. Historical volatility indicated that the price from the prior month's close could range between $3,018 and $3,585 in the next 30 days. Investors and traders may consider weekly support ($2,470 to $2,566) or resistance ($4,283 to $4,439) levels for planning their trading strategies.
As the Asian tech market remains dynamic and responsive to various factors, traders should leverage powerful trading technology like AutoClimate and AutoUFOs for in-depth market analysis, risk management, and identifying potential opportunities. These advanced tools, favored by professional traders, offer valuable insights into market trends and complexities.
The ATI index is composed of a diverse mix of countries, including China, Japan, Taiwan, and South Korea. Each of these countries contributes to the index's overall performance, making it essential for traders to stay updated on economic developments, geopolitical factors, and technological advancements in these regions.
In conclusion, navigating the Asian tech market requires meticulous analysis, continuous monitoring of market conditions, and a well-structured risk management strategy. Traders should remain vigilant about upcoming high-impact events, such as China CPI, China Retail Sales, and China Manufacturing & Non-Manufacturing PMI, as these can significantly impact market dynamics. Staying informed about regulatory changes and technological innovations in the Asian tech sector is crucial for making informed trading decisions. However, it's essential to remember that trading carries inherent risks, and professional financial advice should be sought before making any investment decisions.
BRENT
Summary:
In August, Mini Brent Crude Futures (BM) displayed robust performance, surging beyond the $85.00 mark and closing the month at $86.83. Market analysts anticipate further price increases for the remainder of the year, driven by improving demand and ongoing production cuts by key oil-producing nations.
MARKET CONDITIONS:

During the August OPEC Joint Ministerial Monitoring Committee (JMMC) meeting, Saudi Arabia extended its production cuts by 1 million barrels per day, and Russia committed to reducing its production by 300,000 barrels per day for September. These actions are contributing to the upward pressure on oil prices. The next critical JMMC meeting is scheduled for October 4th.
The outlook for oil demand is optimistic, especially in developed economies. Central banks have shown a willingness to pause interest rate hikes, which were aimed at curbing inflation. This pause allows previous rate hikes to stimulate economic growth, further supporting oil demand.
On the supply side, oil-producing nations are maintaining voluntary production cuts, reinforcing the bullish sentiment in the oil market. However, Iran, despite facing U.S. sanctions, witnessed a significant increase in crude oil output and exports in August. Negotiations between Iran and the United States are ongoing, potentially leading to agreements that could impact oil markets.
From a technical perspective, daily indicators for oil futures (BM) point to a strong bias towards buying, and technical oscillators indicate a positive buying sentiment in the market.
Looking ahead, based on historical volatility, the price from the previous month's close could fluctuate between $79 and $94, offering potential opportunities for investors and traders. Weekly support levels at $72.51 to $75.41 and resistance levels at $92.65 to $98.57 are essential considerations for planning entries and exits.
As the oil market remains dynamic and sensitive to global events, traders should consider utilizing advanced trading technology, such as AutoClimate or AutoUFOs, to enhance their market analysis and decision-making processes. These tools, commonly employed by seasoned professionals, provide valuable insights and can help traders navigate the complexities of the oil market.
In conclusion, investing or trading in oil futures requires a comprehensive understanding of supply and demand dynamics, geopolitical factors, and economic conditions. The upcoming JMMC meeting and ongoing negotiations between Iran and the United States are key events to monitor. However, it is essential to remember that trading commodities like oil carries inherent risks, and it is advisable to seek professional financial guidance before making investment decisions.
Please note that this report provides an overview of the market conditions and does not constitute financial advice. It is recommended that individuals seek the guidance of a qualified financial professional before making any investment decisions.
Please feel free to join our ˲tradewithufos community, we provide comprehensive trading courses and trading apps.
Apps for market analysis and trading:
www.tradewithufos.com/apps
FREE forever membership for everyone:
www.tradewithufos.com/membership
TRADDICTIV · Research Team


